Analysis Intro
Create custom variant filters by connecting together nodes representing sources or filters of variants. See analysis nodes
Other variant databases allow similar creation of filters, but VariantGrid can constuct nodes in real-time, enabling rapid exploration of large and difficult genomic data sets.
Analysis Nodes
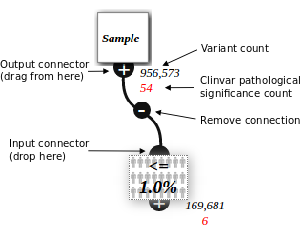 Sample Node connected to a Population Filter Node
The top node is configured to show a particular patient exome (from an uploaded VCF).
These variants are then filtered to those that are less than 1% of the population.
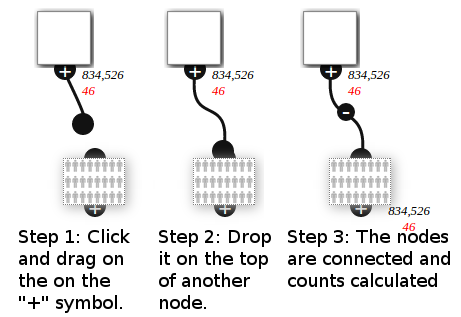 Connecting Nodes
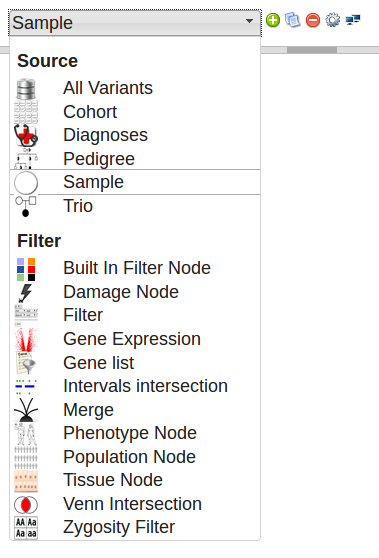
To add a node, select the node type from the drop down menu in the top left of the screen and click the ![]() add button
add button
Click and drag a node to move it around. You can select multiple nodes by drag-selecting a box around them. This allows you to copy, delete or move them as a group. Delete selected nodes by pressing DELETE, or click the ![]() delete button.
delete button.
Analysis screen
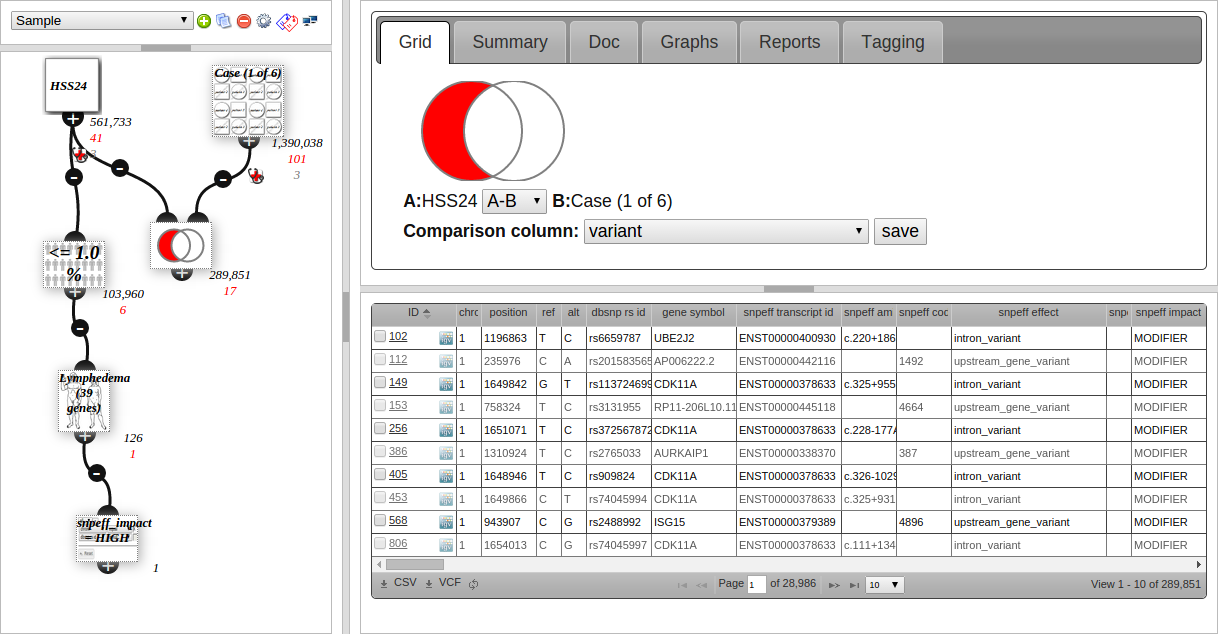
The screenshot above shows the VariantGrid analysis screen. The node graph is on the left part of the screen, showing the user built filters.
Click a node to select it. This loads the node editor (top right) and a grid of the variants (see section below) in the node (bottom right).
Clicking on the node loads this editor window. The node editor is different depending on the type of node.
Analysis Grid
The 1st column (ID) is special and contains a check box, a numbered link and an IGV logo. The check box is used to select rows manually. The link loads detailed information about that variant above the grid. The IGV link will view the locus in IGV (loading bam files associated with samples). See IGV Integration page. Clicking on a row highlights it. Select the “tagging” tab, then click on a label to tag/colour the row.